Jake VanderPlas
Python Data Science Handbook(在线版)
认识 NumPy、pandas、Matplotlib 与 scikit-learn 的数据分析工作流。
VanderPlas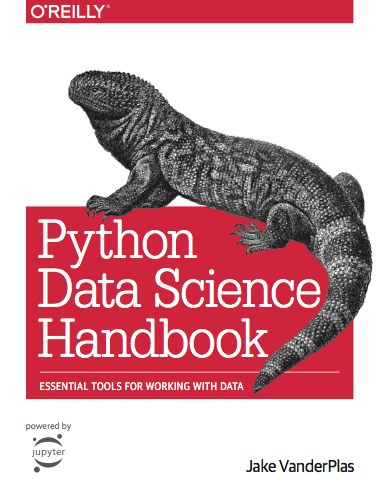
- 难度
- 见前置条件
- 形式
- 书籍
- 语言
- 英文
- 规模
- 67 个课节
- 内容费用
- 免费
- 动手
- 需要动手环境
第一次学这门课?先完成学前准备,把课程目录搭好。
每节课这样学
- 发提示词把下面的每课提示词发给 AI Agent,它会准备这一课的练习文件。
- 学官方课节打开对应课节学习,按提示从第一道练习做起;它不会替你写答案。
- 记进度学完让 AI Agent 在 progress.md 勾选,并把疑问整理到 questions.md。
每课提示词 · 每次学习前用
继续学习「Python Data Science Handbook(在线版)」。课程目录是 python-data-science/(不知道完整路径就先问我)。
1. 读 progress.md,找到下一课;如果我指定了第几课,就准备那一课。
2. 打开这一课的官方页面和本地讲义,列出本课练习要用的工具、文件和样例数据。缺少的先告诉我,等我同意再安装或下载。
3. 在 lessons/ 对应的课节文件夹里准备好练习:exercises/ 里给每道题建一个文件,写上题号和题目原文链接,不写答案;已有文件保留,样例数据放到 data/。拿不到官方题目或起始代码时记录限制,不编造替代品。
4. 按 README 运行开课时生成的自检脚本或在线检查清单,并检查本课新增工具能否正常使用。
5. 告诉我:本课先读哪几节、从哪道练习开始、大约需要多久。我学完后,帮我在 progress.md 勾选并把问题整理到 questions.md。

边界:
- 需要管理员权限、会产生费用或需要填写密钥的操作,先告诉我原因,等我同意。密钥由我在本机配置,不发到聊天,不写进笔记或版本库;原项目需要 .env 时确认已被 Git 忽略。
- 不替我写练习或作业答案,也不替我提交。我卡住时只给提示;我明确要求时才给解答。
- 只下载许可允许个人保存的材料;其余只放链接。不把未运行的命令说成成功。
课节共 67 节 · 官方顺序
- 01Preface
- 021. IPython: Beyond Normal Python
- 03Help and Documentation in IPython
- 04Keyboard Shortcuts in the IPython Shell
- 05IPython Magic Commands
- 06Input and Output History
- 07IPython and Shell Commands
- 08Errors and Debugging
- 09Profiling and Timing Code
- 10More IPython Resources
- 112. Introduction to NumPy
- 12Understanding Data Types in Python
展开其余 55 节
- 13The Basics of NumPy Arrays
- 14Computation on NumPy Arrays: Universal Functions
- 15Aggregations: Min, Max, and Everything In Between
- 16Computation on Arrays: Broadcasting
- 17Comparisons, Masks, and Boolean Logic
- 18Fancy Indexing
- 19Sorting Arrays
- 20Structured Data: NumPy's Structured Arrays
- 213. Data Manipulation with Pandas
- 22Introducing Pandas Objects
- 23Data Indexing and Selection
- 24Operating on Data in Pandas
- 25Handling Missing Data
- 26Hierarchical Indexing
- 27Combining Datasets: Concat and Append
- 28Combining Datasets: Merge and Join
- 29Aggregation and Grouping
- 30Pivot Tables
- 31Vectorized String Operations
- 32Working with Time Series
- 33High-Performance Pandas: eval() and query()
- 34Further Resources
- 354. Visualization with Matplotlib
- 36Simple Line Plots
- 37Simple Scatter Plots
- 38Visualizing Errors
- 39Density and Contour Plots
- 40Histograms, Binnings, and Density
- 41Customizing Plot Legends
- 42Customizing Colorbars
- 43Multiple Subplots
- 44Text and Annotation
- 45Customizing Ticks
- 46Customizing Matplotlib: Configurations and Stylesheets
- 47Three-Dimensional Plotting in Matplotlib
- 48Geographic Data with Basemap
- 49Visualization with Seaborn
- 50Further Resources
- 515. Machine Learning
- 52What Is Machine Learning?
- 53Introducing Scikit-Learn
- 54Hyperparameters and Model Validation
- 55Feature Engineering
- 56In Depth: Naive Bayes Classification
- 57In Depth: Linear Regression
- 58In-Depth: Support Vector Machines
- 59In-Depth: Decision Trees and Random Forests
- 60In Depth: Principal Component Analysis
- 61In-Depth: Manifold Learning
- 62In Depth: k-Means Clustering
- 63In Depth: Gaussian Mixture Models
- 64In-Depth: Kernel Density Estimation
- 65Application: A Face Detection Pipeline
- 66Further Machine Learning Resources
- 67Appendix: Figure Code
来源与使用须知
- 原始资源
- Jake VanderPlas 收录版本:作者在线 notebook 版;不推断与纸质最新版相同
- 收录时间
- 本站首次收录 2026-10-10
- 指南参考
- 作者在线版目录和运行说明
版权与转载
- MIT(代码);CC BY-NC-ND 3.0 Unported(文字):可原样转载,需署名;不得修改;仅限非商业用途;适用范围以原站说明为准,第三方材料可能另有条款。原站说明
- 本站只提供原始链接和学习指南,不转载、不镜像课程材料;课程图像来自原站,版权与商标归原权利人;引用时请注明原作者与出处。